It should come as no surprise that an organization driven by technology measures the use of that technology on a regular basis. The chart below is one example of the reports that cross my desk and it’s a good indicator of Hixny’s efforts over the last year or so.
This simple chart shows the number of times you, our users, have pulled data from Hixny in the past year. In January 2018, we saw 47,000 pulls—our highest January ever. That’s been followed by our highest February and highest March on record.
The chart below represents a moving average of pulls within 12 months.
I’ve written before about our ongoing efforts to listen—and respond—to your interests and concerns. As a result, we’re working to speak even more clearly about Hixny’s value and ability to help you save time.
We see these usage numbers as a reflection of growing understanding about the tremendous resource Hixny provides for our region. As we continue our efforts, we anticipate seeing these numbers continue to grow throughout the year. Thank you for working with us!
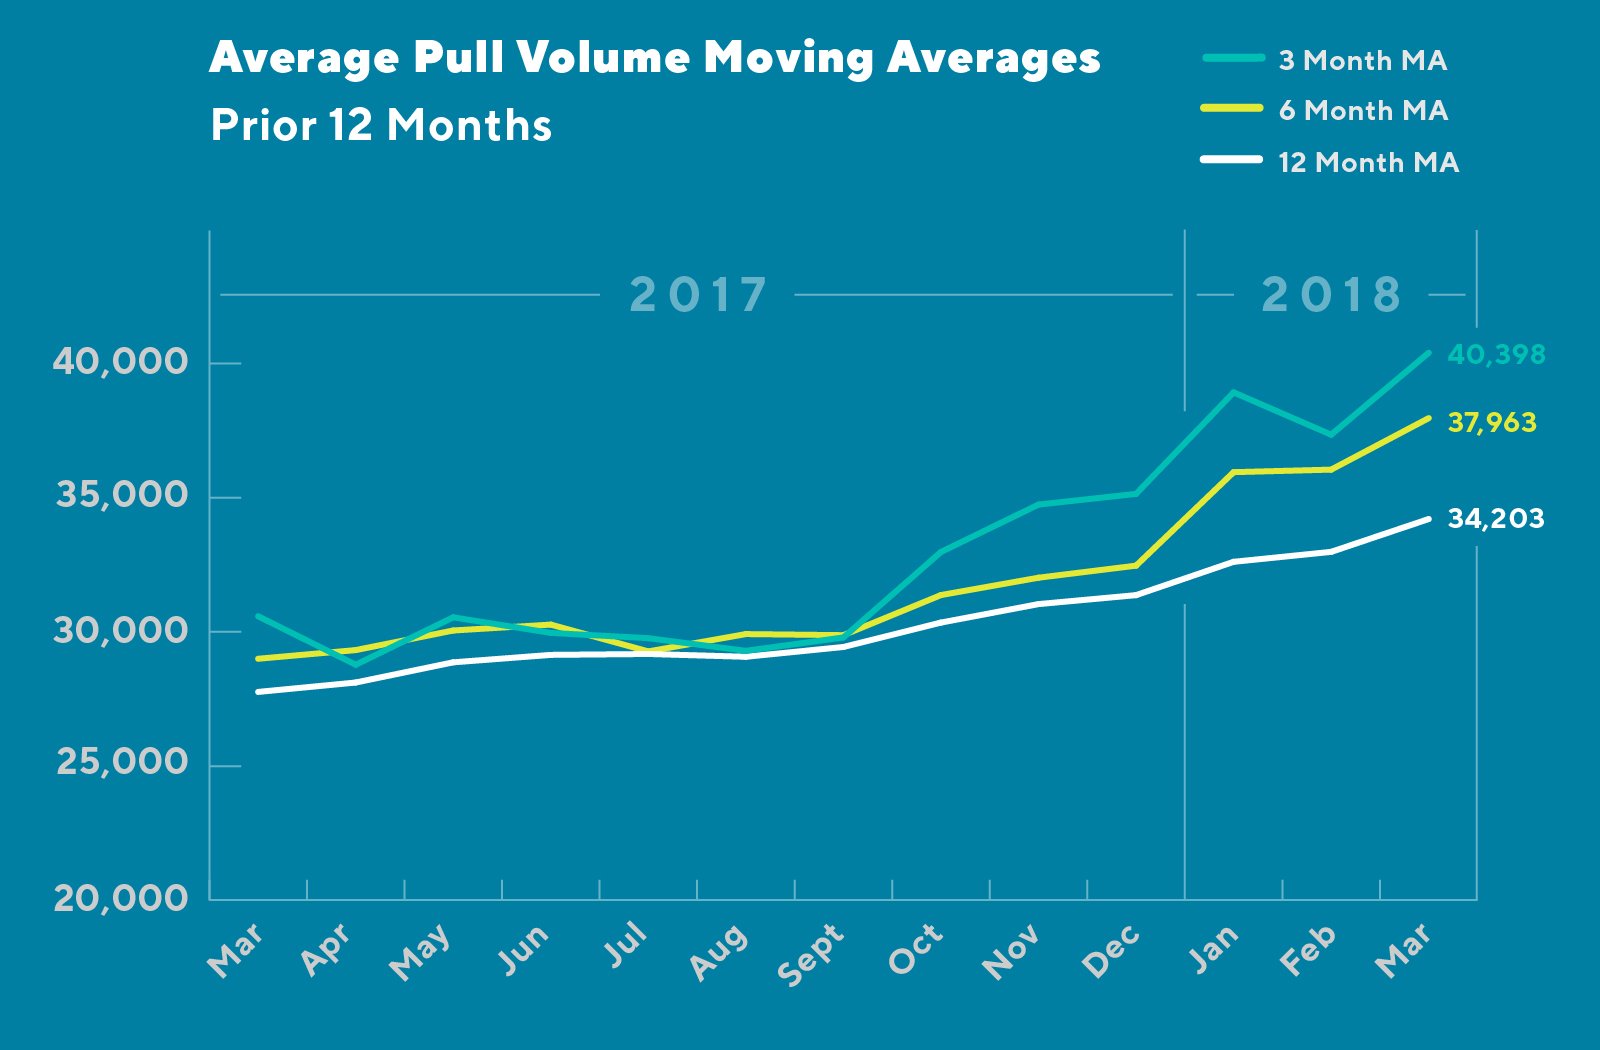
Text version of graph Average Pull Volume Moving Averages
Graph showing the number of times users have pulled data from Hixny from March 2017 to March 2018. The x-axis shows the months from March 2017 through March 2018. The y-axis shows the number of times users have pulled data, ranging from 20,000 to 40,000. There are three lines on the graph, representing different intervals (3, 6 and 12 months) of moving averages. There is a gradual upward trend for the 12 month moving average, with an overall increase of approximately 7000. The 6 month moving average shows a gradual upward trend from March 2017 to December 2017. There was one decrease between the months of June and July, with a more drastic upward trend starting in December of 2017, for an overall increase of approximately 9,000. The 3 month moving average is more variable. An initial decrease in the numbers is regained and followed by a gradual decrease, from March to September 2017. A drastic increase from September 2017 through January 2018, is followed by another decrease from January to February, increasing again in March, for an overall gain of approximately 10,000.
